In our life the speed of movement Vehicle measured in kilometers per hour (km/h). This is how the movement of a car, train, or plane is characterized. But there is one exception to this rule. In maritime navigation, the speed of a ship is indicated in knots. This unit of measurement is not included in the International SI System, but is traditionally accepted for use in navigation.
Vessel speed measurement
This order has developed historically. Once upon a time, the speed of a ship's movement was determined using a special device called sector log. It was a board, at the end of which a line was attached - a thin ship's cable. Knots were tied at regular intervals along its entire length. The sailor, touching the cable with his hand, counted the number of knots that passed through his hand in a certain time, thus determining the speed immediately in knots. It is important that this method did not require any additional calculations.
No one has been using lags of this design for a long time. Now to measure speed sea vessels they use instruments based on the latest scientific and technical achievements in the field of hydroacoustics and hydrodynamics. Meters based on the Doppler effect are popular. There are simpler methods - using special metal turntables placed in water. In this case, the speed is determined based on the number of revolutions per unit time.
Nautical mile
Translated into ordinary language, one knot means the speed at which a ship travels one nautical mile in an hour. At first its value was 1853.184 meters. This is exactly the length of the Earth's surface along the meridian in one arc minute. It was only in 1929 that the International Conference in Monaco established the length nautical miles at 1852 meters.
It must be remembered that, in addition to the nautical mile, there are others. In the past, several dozen different miles existed as units of measurement for length in different countries. After the introduction of the metric system, miles as a unit of measurement of distances began to rapidly lose popularity. Today, out of all the variety of land miles, only about ten remain. The most common of them is American mile. Its length is 1609.34 meters.
Not only the nautical mile is attached to the length of the earth's meridian. The old French unit of length, nautical league, is equal to 5555.6 meters, which corresponds to three nautical miles. It is interesting that, in addition to the sea league, in France there was also a land league, also tied to the length of the meridian, and a postal league.

Speed recalculation rules
Today, the speed of sea vessels is still measured in knots. In order to present this characteristic in a form familiar to us, it is necessary to convert them into kilometers per hour. It can be done in several ways:
- Just multiply the number of nodes by 1.852 by any number in an accessible way, for example, using a calculator.
- Make a rough calculation in your head by multiplying the number of nodes by 1.85.
- Apply special translation tables from the Internet.
Having made such a recalculation, it is easy to compare the speeds of sea vessels and other vehicles.

Record holders among ships
Speed of sea passenger ships usually higher than trading ones. The latest official record (“Blue Ribbon of the Atlantic”) belongs to the American high-speed transatlantic liner "United States". It was installed in 1952. Then the liner crossed the Atlantic at an average speed of 35 knots (64.7 km/h).
The infamous Titanic, on its only voyage, was sailing almost at the limit of its technical capabilities at a speed of 22 knots when it hit an iceberg on the night of April 14-15, 1912. The highest speed then passenger airliners(“Mauritania” and “Lusitania”) was 25 knots (46.3 km/h).

Here are some of the ships that were once winners of the Atlantic Blue Ribbon:
- Great Western (Great Britain) in 1838.
- "Britannia" (Great Britain) in 1840.
- "Baltic" (Great Britain) in 1873.
- "Kaiser Wilhelm der Grosse" (Germany) in 1897.
- Lusitania (Great Britain) in 1909.
- "Rex" (Italy) in 1933.
- Queen Mary (Great Britain) in 1936.
There is a separate category of ships - hydrofoils, which are used for passenger transportation and the Coast Guard. They can reach speeds of over 100 km/h (60 knots), but their range of use at sea is severely limited to the coastal zone and low economic characteristics.

Changing priorities
With the development of aviation, such active competition among ocean-going passenger ships has lost its relevance. Passengers began to prefer airplanes to cross the Atlantic, and ship-owning companies had to reorient themselves to serving tourists. For cruise ships The most important indicators were reliability, comfort and economic efficiency.
Optimal speed of modern ocean cruise ships is usually from 20 to 30 knots, and for cargo ships- approximately 15 knots. A record achievement for that time, United States remains the highest in history. For merchant ships today, the priority indicators are primarily economic. The pursuit of records is finally a thing of the past.
Video
In this video collection you will find a lot interesting information regarding the measurement of the speed of maritime transport.
Determination of the ship's speed based on the propeller speed.
A log is used to measure the speed of large ships. On small ships, a simple log gives large errors in determining speed and cannot always be used. Therefore, for small vessels it is easier to determine the speed using tables or graphs expressing the dependence of speed on the number of propeller revolutions. To have such tables or graphs, you need to determine the speed of the ship on the measuring line for different propeller speeds (Fig. 59). Speed determination is carried out in favorable weather. The yaw of the vessel on course should not exceed ±2°.
Rice. 59. Measuring line equipment diagram
The measuring line is equipped with a leading line along which the ship steers course, and four or more secant lines, the distances between which are accurately measured. The ship's speed on the measuring line is measured with the engine running at constant speed. To eliminate errors in determining speed due to the influence of wind and current, two runs are made at the same engine operating mode - in one direction and the other.
Using a stopwatch, the moment the vessel passes the cross-sections is noted. Knowing the time t 1, t 2, t 3 and the distances between the secant sections S 1, S 2, S 3, the speed V S is calculated using the formula:
V S = S
where: V S - ship speed in knots;
S - distance between secant sections in miles;
t - travel time from target to target, sec.
During each run, it is important to accurately maintain the specified engine speed. Having calculated the individual speeds V 1, V 2, V 3, the average is found.
After determining the speed on the measuring line, a table or graph of the dependence of the ship’s speed on the engine speed is constructed (Fig. 60).
It is useful to determine the ship's speed at different drafts. Then there will be several graphs and tables. For ease of use, they can be depicted on one sheet of paper. Having such tables or graphs on the ship, you can use a given number of engine revolutions and a known draft to find the corresponding speed of the ship.
Sometimes there is no equipped measuring line nearby. However, to determine the speed of a vessel, it is always possible to select two coastal landmarks, the distance between which is known quite accurately. These distances can be determined, for example, from a plan that contains both landmarks.
The leading points can be replaced by a compass on the ship, if there is no fear that the ship will be blown off course by the wind or current; to do this, it is necessary to check and eliminate the influence of the running engine on the compass.
To measure the speed of the ship, it must be on a straight course along a route that is safe for navigation.

Puc. 60. Graph of ship speed versus engine speed
The direction of the straight line connecting objects can be determined using a compass, but it is necessary that runs can be made in a direction parallel to the straight line connecting the objects.
In advance of approaching the first landmark, the ship develops a certain speed and sets a measured course at a given engine speed, which remains constant during the run to the second landmark. When the first landmark is abeam, the stopwatch is started or the time is noted on the clock. The time is counted at the moment the vessel passes the beam of the second landmark. The same observations are made during the return run.
§ 27. A simplified method for determining the speed of a ship.
If it is impossible, especially during navigation, to determine the speed of the vessel using one of the methods described above, another, albeit less accurate, method is used. While moving, you need to throw a temporary reference point into the water from the bow of the ship - a small piece of wood and at the same time start the stopwatch. When the piece of wood reaches the cut of the stern, the stopwatch is stopped. Based on the measured time and the known length of the vessel, the speed is found using the formula:
V S = ,
where V S is the speed of the vessel in knots;
L - length of the vessel, m;
t- time of passage of an object thrown into the water, sec.
It should be borne in mind that the shorter the vessel, the greater the error will be.
When determining the distance traveled, you need to remember that the vessel moves only relative to the water, not the ground. Wind and current are not taken into account, although they constantly influence the speed of the vessel. Therefore, when driving the laying at a distance calculated by speed, it is necessary to introduce a correction due to drift by current and wind. This is easiest to do when the ship's course coincides with the direction of the current and wind or is opposite to them. During lateral drifts, the increase or decrease in speed will be approximately proportional to the cosine of the angle between the ship's course and the lines of action of the current or wind.
The main reasons for reducing the speed of the vessel:
1) shallow water, in which water resistance increases sharply as speed increases. Therefore, in shallow water the speed can decrease by 10 - 15%;
2) wind and pitching. With headwinds and waves, as well as with strong tailwinds accompanied by waves, the speed decreases.
With weak tailwinds, the speed increases slightly. A decrease in speed is observed when the vessel is overloaded, heeled and trimmed to the bow. On a wave, at the moments when the propeller leaves the water, the ship suddenly loses speed;
3) fouling of the underwater part of the ship's hull leads to a decrease in speed by 10 - 15% compared to the speed of a ship with a clean hull.
5.2. Principles for measuring ship speed
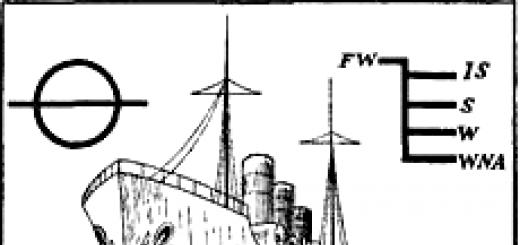
The speed of the vessel is measured with special devices ® lags . Currently, the following systems (types) of logs are used on ships:
Vertical logs (produced on the lagline and bottom).
The speed of rotation of the turntable is proportional to the speed of the vessel. The proportionality coefficient is determined by testing. The number of revolutions of the turntable is recorded on a counter indicating the distance traveled by the vessel.
Hydrodynamic logs (GDL).
The receiving devices of these logs measure the high-speed water pressure that occurs when the vessel moves. Based on the measured pressure value (the difference between dynamic and static pressures), the lag's calculation and decision circuit generates the vessel's speed and the distance it has traveled. To measure the pressure difference in these logs, spring (bellows) and liquid (mercury) differential pressure gauges are used. (LG-25, LG-50, LG-4, LG-6, MLG-25, MLG-50, etc.).
Induction logs (IEL).
The operating principle of these logs is based on the phenomenon of electromagnetic induction that occurs when sea water moves between two electrodes in an alternating magnetic field. The source of the magnetic field in the log is an electromagnet powered by alternating current. It is enclosed in a fairing, on the surface of which there are two measuring electrodes in contact with sea water. Under the influence of the alternating magnetic field of a magnet, water appears variable emf. The amplitude of this emf. turns out to be proportional to the speed of movement of the electromagnet, and therefore the ship. The signal taken from the electrodes is measured using the compensation method. If hydrodynamic logs give stable readings when V>3 knots., then induction® with almost 0 knots
Hydroacoustic logs (GAL).
The principle of their operation is based using the Doppler effect. A pulse of ultrasonic vibrations sent from the ship is reflected from the ground and returns back to the ship's log receiver. When the ship is moving The frequency of the received signal will differ from the emitted one depending on the speed of travel.
GALs measure the speed of the vessel not relative to the water, like all those mentioned above, but relative to the ground and therefore are considered absolute lags ( not relative). However, stable operation of these logs is possible at relatively shallow sea depths, but the accuracy of their work is very high.
Logs of all systems, like any other devices, cannot give absolutely accurate readings; they require periodic verification and adjustment. That part of the error in the log readings that cannot be compensated is determined on the “measuring line” and then taken into account using a log correction.
Lag correction – a value equal to the relative error, expressed as a percentage and taken with the opposite sign, i.e.
Where S L– actual distance traveled by the vessel;
ROL– the distance traveled by the vessel according to the log counter ( ROL=OL 2 -OL 1 )
 (5.7)
(5.7)
Where V 0 – true speed of the vessel;
V L– speed of the vessel according to log readings.
5.3. Determination of ship speed. Correction and lag coefficient
Speed of the vessel or ship ( V) and corrections to their lags (D L%) are determined in various ways:
on a visual measuring line;
using ship's radar;
using high-precision RNS;
on a cable measuring line, etc.
All methods of determination V andD L% differ from each other only in the method of obtaining the true distance ( S), necessary to calculate the true speed of the vessel ( V 0)®see rice. 5.4, 5.5, 5.6.
Let's consider one of the methods ®determining the speed of a vessel ( V) and its lag corrections (D L%) on the visual measuring line.
Visual measuring line ®a specially equipped testing ground for high-speed testing of ships.
Such a training ground must meet the following requirements:
– be located away from the paths of ships and vessels;
– be free from navigational hazards (>2 miles) and sheltered from wind and waves;
– must provide freedom of maneuver ( V£36 bonds.® L= 3miles;V£24 bonds.® L= 2miles And V£12 bonds.® L= 1mile);
– be able to ensure the required accuracy of position determination and navigation safety;
– have depths that exclude the influence of shallow water on the speed of the vessel (with a draft of 5 m And V£30 knot N³ 95m).

Rice. 5.1. Visual measuring line
The visual measuring line is equipped with secants ( B, C, D) alignments (not<2-х), направление которых перпендикулярно линии пробега судна (рис. 5.1), а расстояние между створами измерено с высокой точностью.
Some measuring lines are equipped with a leading alignment along which the vessel's line of travel is directed ( A).
Method for determining travel speed ( V) and lag corrections (D L%) boils down to the following:
®vessel, at a steady state of propulsion operation, i.e. at a constant number of revolutions of the propellers (propellers), makes a run along the leading target A. (In the absence of a leading alignment, the course during the run is kept perpendicular to the direction of the secant alignments B, C, D).
When crossing the line I of the secant alignment ( B) on the command “Zero!” The observers' stopwatches are switched on and the lag count is taken ( OL 1 ) and counting from the total counter of propulsion revolutions ( n 1 ).
When crossing the line II of the secant alignment ( G or IN) on the command “Zero!” The stopwatch is stopped and the following is removed: – the lag countdown ( OL 2 ) and counting from the total counter of propulsion revolutions ( n 2 ).
®the true speed of the vessel during the run is calculated using the formula:
 (5.8)
(5.8)
Where S– distance (from the form or description of the measuring line) between secant sections B And G(or B And IN or IN And G) (i.e. the length of the run, which is set depending on the speed of the vessel during the run: if V<12bonds. – 1mile; If V= 12¸24 bonds. – 2miles; If V>24bonds. – 3miles);
t i – average running time in seconds (average time of all stopwatches).
®the speed of the vessel during the run along the log is calculated using the formula:
 (5.9)
(5.9)
Where ROL = OL 2 – OL 1 – difference in lag counts (lag counter readings).
®the number of propulsion revolutions per minute during the run is calculated using the formula:
 (5.10)
Where  .
.
®calculate the lag correction as a percentage (D L%) on mileage according to the formula:
 (5.11)
®calculate the lag coefficient ( TO L) on the run according to the formula:
 (5.12)
To eliminate the influence of the flow on the results in each mode of operation of the propulsors, the following is performed:
A)®2 runs each ®if the flow speed in the area of the measuring line is constant;
b)®3 runs each ®if the flow is not constant and its elements ( TO T , u T) are unreliable.
There must be at least 3 operating modes of propulsors (as a rule: I– “PH” – designated move; II– “SH” – 75% of “PH”; III– “MH” – 50% of “PH”). In each mode, (usually) 3 runs are performed and after calculations we have:
1st run:V O1 , V L1 , N 1 , D L 1 %;
2nd run:V O2 , V L2 , N 2 , D L 2 %;
3rd run:V O3 , V L3 , N 3 , D L 3 %.
®calculate the average values of the required quantities for a specific, designated operating mode of the propulsors:
A)®true (relative) speed of the vessel ( V ABOUT) in the mode according to the formula:
 ;
(5.13)
;
(5.13)
b)®speed of the vessel along the log ( V L) in the mode according to the formula:
 ;
(5.14)
;
(5.14)
V)® number of revolutions of the propellers (propellers) in the mode according to the formula:
 ;
(5.15)
;
(5.15)
G)®lag correction in percentage (D L%) in the mode according to the formula:
 ;
(5.16)
;
(5.16)
d)®lag coefficient ( TO L) in the mode according to the formula:
 . (5.17)
Note:
If not 3 but 2 runs are performed in the mode, then formulas (5.13¸5.17) will take the form:
 (5.13A)
 (5.14A)
 (5.15A)
 (5.16A)
 (5.17A)
IImode–V O II, V L II, N O II,D L II%, TO L II;
IIImode–V O III, V L III, N O III,D L III%, TO L III.
®based on the results of measurements on the measuring line, the following are compiled:
|
A) graph of the correspondence between the speed of the vessel and the rotational speed of the propulsors (Fig. 5.2) |
b) lag correction correspondence plot (D L%) vessel speed (Fig. 5.3) |
|
Rice. 5. 2 . Speed Compliance Chart progress vessel speed of rotation of its propulsors |
Rice . 5. 3 . Compliance schedule ship speed log corrections |


Data is taken from these graphs to fill out the navigator's work tables (RTS).
Correspondence of travel speed to the speed of rotation of the propulsors
and correction (coefficient) of the lag
05/12/2016
In order to become navigator professional, you need to read a lot of navigation, authored by scientists. In this article, using a simple language not loaded with complex terminology, we will try to find out - what speeds do the navigator take into account?.
When we talk about the speed of a ship, we consider two quantities. One of them - this is the movement of a ship on water. Direct connection between the propulsion unit, the hull of the vessel and the aquatic environment. The second is movement of a ship in relation to world space. This is the path, the segment that we have covered in a certain time. The fact is that the world Ocean and the entire water shell of the Earth are not static. She is free in her movement, although she is subject to physical laws. The system of world waters, their interaction, creates the movement of water masses, and a sea vessel, along with any straw, participates in this movement on a colossal scale. Also, do not forget about in the wind, which also affects the speed of the ship. More details about everything.
STW— Speed Through the Water — Vessel speed relative to water
SOG— Speed Over Ground — Vessel speed relative to ground
Knot—Knot— a unit of measurement for ship speed. Nautical miles per hour.
So, we are on watch, going from point A to point B. At full speed, the propeller is thrashing the water, our ship, swaying on the waves, cuts the water with its stem. - this is the water in which our ship, its hull and propeller are immersed. With positive operation of this system, the vessel, like a physical body, moves in the aquatic environment, receiving support. Let's compare this to a swimmer who methodically rows from one wall to another in a pool. His body moves through the water, which is limited by the walls of the pool and has no current that would affect the swimmer. Using only his physical strength, he overcomes the distance, walking along the water.

Let's return to our ship. Since it is located in the system of world currents, then this entire mass of water moves in a certain direction, carrying the ship with it. If we stop our ship, STW will be 0. But we will move around the globe along with the water, moving from one point to another. Let's get the ship moving again. Added to the navigation map location. Spotted time. New applied location. Measured distance traveled, divided by time, what we detected. We obtained the speed of the ship relative to the ground - SOG. Abstractly, consider our ship as a physical point that moves around the planet at a certain speed. 
Let's remember our swimmer. After the pool we invited him to swim in the river. At first he tried not to row, and he was carried downstream. The speed of movement relative to coastal objects became equal to the speed of the current. He began to row upstream. To return to the place where he started, he had to swim faster than the current. He swam quickly relative to the water ( STW), like in a swimming pool. But relative to coastal objects, his body did not move so quickly. The river current “ate” him SOG. And on the contrary, if he swam downstream, it would help him move.

Lag- a device for measuring the speed of a ship on water (there are different types, more details). These are the simplest and most primitive examples. To fully understand the picture, the navigator should learn the basics vector geometry, namely, addition and subtraction of vectors.
In modern navigation we have at our disposal a device satellite observation — GPS, which continuously gives location vessel, respectively, calculating SOG, which undoubtedly helps the navigator during work.
Next, on SOG can have a significant impact by creating wind drift. Especially, it affects ships with great windage y, such as container ships, RO-RO, passenger ships, large tankers in ballast displacement and others. For example, in a strong headwind SOG will decrease, and vice versa, with a favorable direction the wind will “help” the ship overcome the resistance of the water.
We hope this introductory article will become “ Navigation. First steps. Vessel speed." will help you in understanding science Navigation .
Liked? click:
Navigation. First steps. Vessel speed. (c) NavLib
By lag. The accuracy of orientation largely depends on reliable information about the speed of the vessel. When swimming on lakes and reservoirs, the average speed relative to the bottom can be determined by the log.
Logs come in various designs. Turntable logs, operating on the principle of a hydrometric turntable, are stationary and extend as needed from the bottom of the vessel. Hydrodynamic logs are two tubes that measure the pressure of sea water when driving and parking. The higher the speed, the higher the pressure in one of the tubes. The pressure difference can be used to judge the ship's speed. In general, logs are complex electromechanical devices.
The river flow, acting on the log, allows one to determine from it only the speed of the vessel relative to calm water, but not relative to the banks. In addition, uneven currents and the movement of the vessel in turns of the channel distort the log readings.
Along the length of the ship's hull. The speed of the vessel relative to the bottom can be determined using one of the methods described below. At the bow and stern, two planes of superstructures are selected, perpendicular to the centerline plane of the vessel, or two objects creating folding sighting planes. There are two observers in the bow and stern sighting planes N and K(Fig. 78). Observers choose a stationary object P, located on the shore or water. At the moment the object arrives at the nasal sighting plane, the observer N gives a signal that the observer TO notices the time. When the item arrives P observer in the rear sighting plane TO. also makes a timestamp. The speed is calculated from the distance between the sighting planes / and time.
Time recordings can be made by the third observer located on the bridge, according to the signs of the observers N And TO at the moment the item arrives P into the sighting planes.
Rice. 78. Towards the determination of speed
movement of the ship along the length of its hull
Speed is calculated less accurately when sighting an object P one ship object at a time when there is no sighting plane or when the sighting object is abeam the ship’s stem and sternpost.
Using direction finding of an object. The essence of this simple and reliable
The method is as follows. In the center plane of a ship moving on a straight course, the distance between points a and b (Fig. 79) is measured l, called the basis. Being at points a and b , observers at the same moments measure angles a1 a2 a3 B1 B2 B3, etc. between the base and the direction to the object P.
When processing the obtained measurements, an arbitrary line is drawn on a sheet of paper, on which a point is placed that determines the object being taken. From this point, at measured angles a1, b1, etc., bearing lines of arbitrary length are drawn. Noticing the length of the base on a ruler on any scale, place it between the bearing lines, parallel to the course, until it touches them with the corresponding marks. In this way, the position of the ship’s hull is determined at the moments of bearing finding. The distance traveled by the vessel during direction finding, taking into account the accepted scale, is taken directly from the diagram.
To construct a diagram, two direction finding is sufficient, but the result obtained with several direction finding is more reliable.
Direction finding of an object is carried out using a compass or other goniometric instrument. If they are not available, use a tablet, which can be a sheet of plywood, thick cardboard, a piece of wide board or a deck table.
A tablet with a sheet of paper is installed above the sighting site. A line is drawn on the sheet that coincides with the base line. The direction finder is a wooden block with a smooth edge.
At the moment of direction finding, the observer, directing the cut of the block towards the object, draws a pencil line and marks it with the measurement number. Angles are removed from the tablet using a protractor.

Rice. 79. To determine the speed of a ship using direction finding of an object from it
Direction finding is carried out as follows. The observers, having checked their watches, go to their places. At the same moments, for example after 15 or 20 s, they take the bearing of the same object. Direction finding can occur based on signals from a third observer. By determining the distance traveled and time, it is easy to calculate the speed.
The proposed method is applicable to determine the maneuvering qualities of a vessel: inertial path, circulation, etc.
Based on the relative speed of approach of ships. Knowing the distances between oncoming or overtaken vessels, as well as the speed of the oncoming or overtaken vessel, you can determine the speed of your vessel or, conversely, use your own speed to calculate the speed of the oncoming or overtaken vessel. |
Let us denote: S - distance between vessels, v1 - the speed of our ship, v2 - the speed of the oncoming or overtaken ship, t- time of approach. Then
In this formula, the plus sign “+” is taken for the case of ships meeting, and the minus sign (-) for overtaking.
When overtaking ships, the relative speed of approach is equal to the difference in speed, and when meeting, it is the sum of the speeds of both ships. In other words, in the first case, the overtaken vessel seems to stand still, and the overtaking vessel moves at a speed equal to the difference in their speeds. In the second, one of the ships seems to be standing, and the other is moving at a speed equal to the sum of the speeds of both ships.
During swimming, the above formula has limited application and can only be used in special cases. Therefore, the determination of speed, as well as the time and distance covered by ships when meeting and overtaking, can be made using the universal nomogram of D.K. Zemlyanovsky (Fig. 80). It is easy to use, applicable in ship conditions and allows you to quickly solve any problem without intermediate calculations, provided that the ships are moving on the same or parallel courses.
The nomogram has three scales, and each of them has a double dimension for convenience. The rules for using the nomogram are clear from its key. For example, between a motor ship traveling at a speed of 20 km/h and a pushed train at the moment signals are given for divergence, the distance is 2.5 km. It is necessary to determine the speed of the train if the approach time is 300 s.
To determine the speed of the pusher, apply a ruler (pencil, sheet of paper, thread) on the top scale to the 300 s mark (see Fig. 80), and on the middle scale to the 2.5 km mark. The answer is read on the lower scale - 30 km/h. This is the joint closing speed, hence the pusher speed is 10 km/h.
As you know, in ship conditions when sailing on inland waterways, it is often not possible to perform even simple arithmetic calculations.

Rice. 80. Nomogram for determining the speed of a ship, the time and distance covered by ships when meeting and overtaking
couples. Therefore, the nomogram can be used to solve problems about time and path when meeting and overtaking ships.
We will show the methods of calculation using the nomogram using examples. Boaters should not strive to obtain values that are too precise, such as tenths of a meter and a second. For large distances, it is quite acceptable to round the resulting values to the nearest hundred meters, for small distances - to a dozen or a meter.
Example l. The speed of two oncoming dry cargo ships: the one going down is 23 km/h, the one going up is 15 km/h. The distance between ships is 1.5 km. It is necessary to determine the time and distance covered by the ships before the meeting.
Solution. The total speed of the ships will be 38 km/h. We find a point on the lower scale with a mark of 38 km and apply a ruler to it. We apply the other end of the ruler to the 1500 m mark on the distance scale, and read the answer on the top scale - 140 s.
The speed of the moving ship from above is 23 km/h. We apply a ruler on the lower scale to the 23 km mark, and the other end of the ruler to the 140 s mark, we read the answer on the distance scale - 900 m. Then the path traversed by the boat going below is 600 m.
Example 2. A train 150 m long, going upward at a speed of 8 km/h, from a distance of 300 m, giving the go-ahead, begins to overtake a cargo ship 50 m long, which is moving at a speed of 14 km/h. Calculate the total overtaking time and distance.
Solution, The total distance, i.e. taking into account the lengths of the ship and the composition, is 500 m (300 + 150 4" 50 = 500 m). The speed difference is 5 km/h.
To determine the time, place one end of the ruler on the left scale at the 6 km/h mark, and the middle of the ruler at the 500 m mark on the distance scale. We read the answer on the top scale - 320 s. The total distance covered by the overtaking motor ship from the start of the signal is equal to the product of its speed and the overtaking time. According to the nomogram, this is determined in a well-known way. We apply the end of the ruler to the 14 km/h mark, and the right end to the 320 s time mark. We read the answer on the average scale - 1250 m.
As can be seen from the examples given, with the help of the nomogram you can easily and simply solve any problems of passing and overtaking ships, while being directly on the ship.
Using radar. To determine the speed of movement, radars are the most widely used technical means. On the radar screen there are fixed range circles (RDCs), with which you can determine distances. Some radars have moving range circles (MRCs), which make it even more convenient to measure distances. Having measured the distance traveled on any object using radar and noting the time, the speed of movement is calculated.
According to the navigation map or reference book. IN In this case, the distance traveled is determined using a map or reference book, and the time is determined using a watch. By dividing the length of the covered section by the time, the speed of movement is calculated. This method is most common when sailing on river boats.